~
In low income countries, 5 out of the top 10 causes of death are communicable disease. Bacterial infections, malaria, HIV, ebola - the number of lives lost is huge. The cost to the countries affected is measured in billions of dollars. Even in United States, thousands die to the Flu, with the total financial burden exceeding $87 billion dollars in 2003 [1]. Epidemiological and statistical methods have been used to model illness for decades. These can give us fairly accurate ideas of the behavior of a disease. However, data science methods are sorely underdeveloped in the public health world. Only recently have machine learning methods been applied to illness, and even then only in simple ways.
The Challenge
Every country is different. Within each country each region has different migratory patterns, access to health care, geography, weather patterns, etc. Men and women are not the same. The young and the old are not the same. We can not simply treat every individual as a member of one group. We can not create a model that assumes the world’s countries and regions are the same.
Beyond this, there is a general oversimplification of illness in most circles. In the same way we wrongly believe all cancers are the same, and can be killed by a single solution, we also assume bacteria are all the same. We assume all viruses are the same (and sometimes treat them the same as bacteria). In reality some bacteria are carried by birds. Some are carried by sneezes. Some are carried by mosquitos. Some are drug resistant to a host of common drugs. Some are easily beaten once identified.
Can we have a successful model that doesn’t take into consideration the vector that communicates the drug to the public? The reason we designate difference between the Bird Flue and the Swine Flu is the vector associated. If we treated them the same as the common flu we would be lost.
The problem of predicting epidemic is serious, and it is complicated.
Influenza
The flu kills 23,000 - 40,000 people a year. Most of these are the elderly, but children are also greatly affected. Any touched surface can be a source. This person to person method of transmit is most intuitive to us, and is the most commonly associated way to catch illness.
In 2009 Google released their Google Flu Trends report [2]. They demonstrated a method of using google search results to predict the severity of a flu season. They created a linear model of the log-odds of a search term being associated to an actual doctor visit. This lead to a 97% accurate model for that year.
The incredibly accurate result lead to increased interest in computation methods of disease prediction. Unfortunately, in the years after, there was a huge loss in accuracy. In the 2012-2013 flu season, it predicted almost double the doctor visits than reality. There clearly is danger in having the model be strapped to public search habits. If there is an increase in paranoia about flu, there would be more searches, and more predicted visits. The sensitivity to sensationalization is enormous.
In 2012 a model was published using twitter data [3]. This paper showed that one could use the social ties and colocation information to predict seasonal flu. They developed text mining methods to identify sick and non-sick individuals. They created two SVM classifiers for this purpose. One highly penalized false positives and the other highly penalized false negatives.
Here are the words highly associated with each label
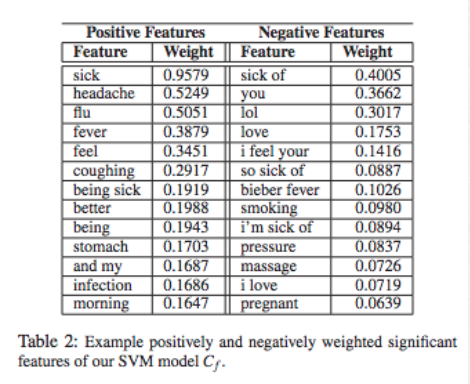
They then used this to label tweets. After this a Conditional Random Field through graphs was used as an unsupervised learner.
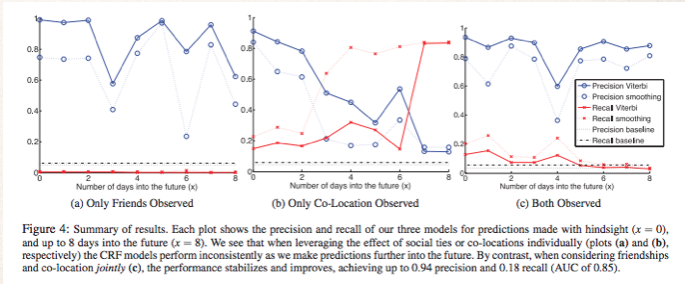
We can see that colocation is not a great way to predict on its own. Only observing friends does a decent, albeit inconsistent job. When they are combined we can see consistent high prediction accuracy for the whole 8 days. They ended up with 94% accuracy.
Unfortunately this is only successful on Twitter data. Methods that rely on internet use are great because of the access to data. They are limited because websites can lose users, or only attract a certain kind of person.
Dengue Fever
Mosquitoes are often associated with Malaria. The devastation that Malaria has caused has earned this. Despite this, there is a nefarious virus that has enormous impact on the world. Most of South America, Asia and Africa are plagued by Dengue Fever. The World Health Organization estimates 390 million people have Dengue Fever every year, with potentially 3.9 billion people at risk [4]. It is more prevalent then ever before and leads to about 23,000 deaths by children.
To model the global range of Dengue Fever, a group used Logistic Regressions to label geographical zone’s susceptibility [5]. They took into consideration average vapor/water pressure, and rainfall.
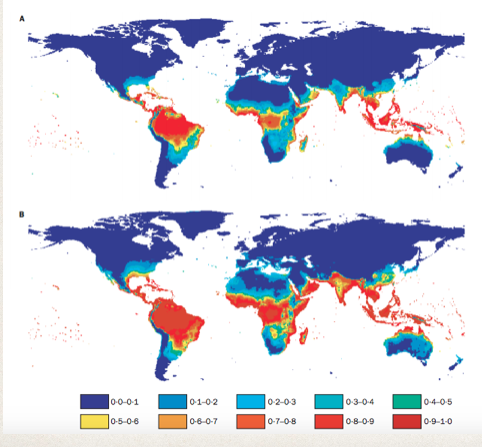
When comparing the range predicted by the Logistic Regression to the actual range, it was found to be 87% accurate. The value of this research goes beyond this to project. The meteorological factors used in the prediction into the future, and they could estimate the future range of Dengue Fever. It was estimated that the range of Dengue Fever would increase from encapsulating 35% of the worlds population to 50%. This model’s value is potential incredibly valuable from a policy standpoint. Should the World Health Organization prepare for this increase? Should it begin to distribute resources differently? Data science allows us to consider these options.
I created this illustration to show the complexity, and value, of Dengue Fever prediction.
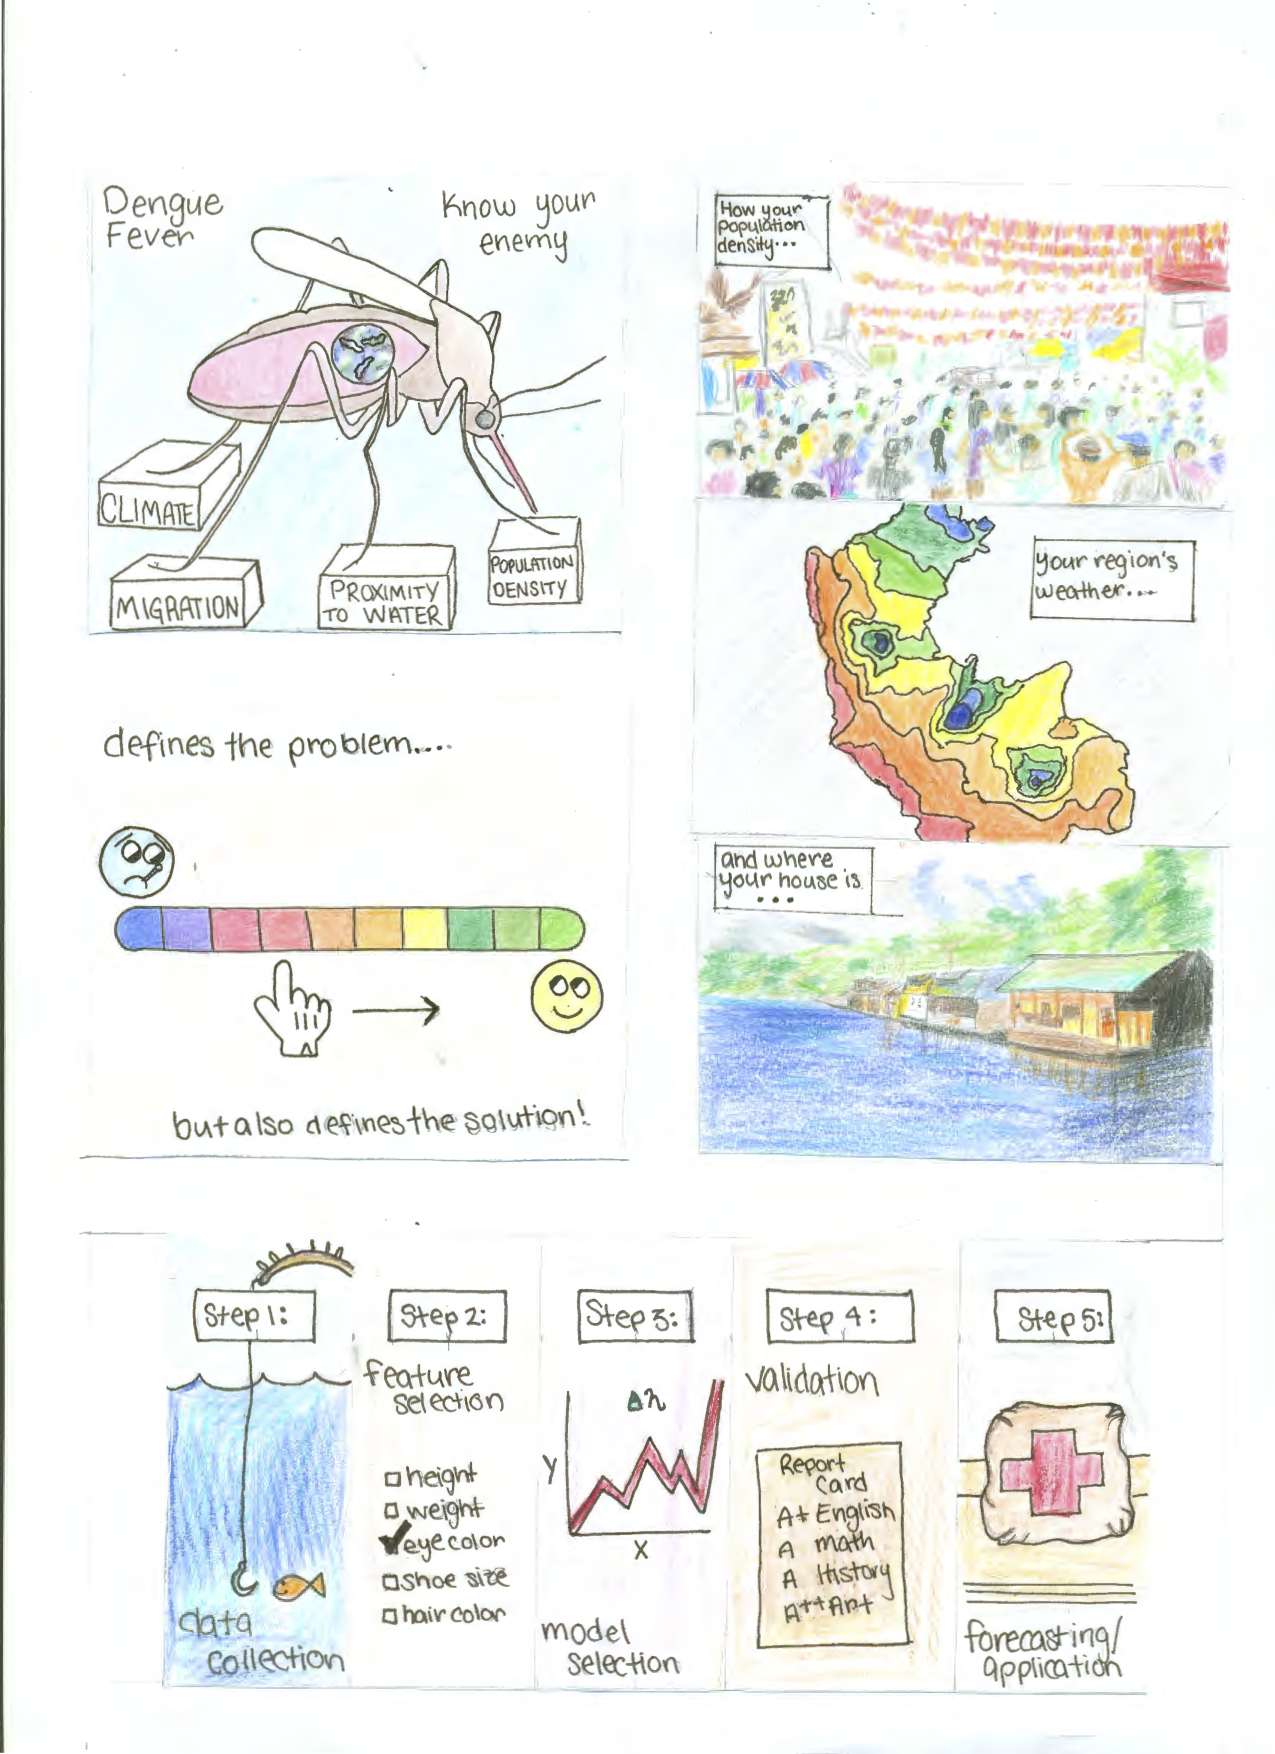
It aims to show how in order to choose the features for your model, you need to firmly understand the context of the problem. Without a firm understanding of your vector you can not hope to properly predict your illness.
In the case of Dengue, it is the mosquito. When mosquito populations are up, so is Dengue. In addition to this, when the mosquito bites an infected individual it can spread it to another person. So we have an issue called ‘Urban Dengue’. This is where the dense populations create easy spread of the disease. however those who live close to wet rural areas are at highest risk. You can easily see how meteorological conditions, population migration, geographical makeup, and of course health infrastructure, could be invaluable features in a model.
Understanding your vector is key to accurate prediction.
Cholera
Of all of the bacteria currently common around the world, Cholera may be the most violent. There are up to 4 million cases a year. It can kill within hours and kills up to 140,000 people a year [6]. Cholera is easily treated if the individual has access to health services. The problem is that outbreaks happen fast and are devestating. The countries most at risk don’t have the health infrastructure to handle these outbreaks without warning. An example is when Haiti had an outbreak after the large earth quake.
A team at Makerere University in Uganda used unsupervised learning algorithms to break the districts of Uganda into 3 clusters [7]. The cluster of the district at highest risk was identified.
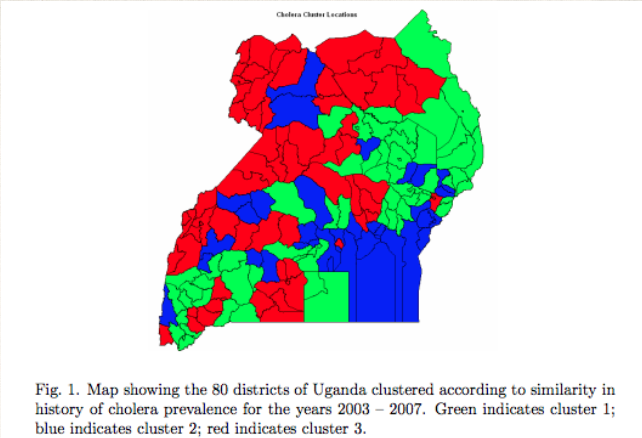
You can see that the red zones of high risk are not obviously placed. Understanding this clustering helps frame the question.
They then used a Dynamic Bayesian Network to predict the number of Cholera cases one week in advance.
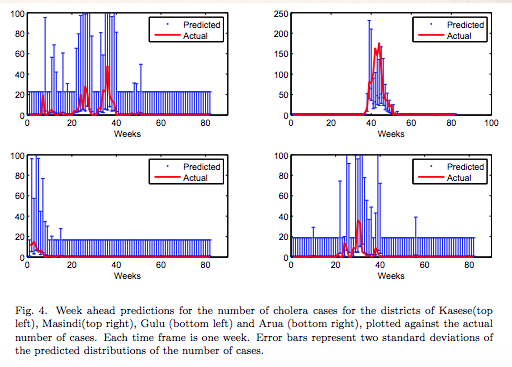
The districts in the risk regions were focused on. They ended up having a 70% accuracy identifying spikes in Cholera cases, although generally overestimated the number of cases. Simply having the ability to estimate a spike is invaluable.
Take-Aways
The potential for machine learning in the public health sphere is complicated. The problems are less simple than many data scientists may initially suspect. The potential good of the endeavor cannot be overstated. If any of the methods I spoke about were able to save lives, or change policy, then that is something that should be aspired to.
Maybe we can find out how predictable these illnesses are. Maybe we can find how similar bacteria and viruses are, in certain scenarios. What is absolutely true is that we need to spend more time using the tools at our disposal to attack these daunting problems.
sources
- http://www.ncbi.nlm.nih.gov/pubmed/17544181
- http://static.googleusercontent.com/external_content/untrusted_dlcp/research.google.com/en/us/archive/papers/detecting-influenza-epidemics.pdf
- http://www.cs.rochester.edu/u/www/u/kautz/papers/Sadilek-Kautz-Silenzio_Predicting-Disease-Transmission-from-Geo-Tagged-Micro-Blog-Data_AAAI-2012.pdfxz
- http://www.who.int/mediacentre/factsheets/fs117/en/
- http://www.thelancet.com/journals/lancet/article/PIIS0140-6736(02)09964-6/abstract?cc=y=
- http://www.who.int/gho/epidemic_diseases/cholera/cases_text/en/
- http://s3.amazonaws.com/academia.edu.documents/31045188/Mubangizi-ICCIR2009.pdf?AWSAccessKeyId=AKIAJ56TQJRTWSMTNPEA&Expires=1443730443&Signature=hWB6T%2BDdlk6vS39Ohid9RA5YDwA%3D&response-content-disposition=inline
2016: Andre Gatorano