~
The Allen Institute for Artificial Intelligence posted a question to http://kaggle.com: How well can you do on a given 8th grade multiple choice test using artificial intelligence? Outside data was allowed in this competition. As impressive and interesting as using the World Wide Web is to take this test, it made me think about whether a model could use the given data and the underlying structure of the test to answer the questions.
So I ask instead: can we get the grade, without studying?
This question is not posed as a hypothetical for college freshmen who think that they can avoid hard work. Instead, it is a question for Data Scientists to investigate how to take a test without actually taking it. Implicit in this investigation, is evaluating whether there are patterns in multiple choice test creation. Are correct answers so decoupled from their parent question that there are no discernible patterns? Or do we subconsciously - or carelessly - create lexical connections between the questions and answers? Given enough questions do we have the means to beat a guesser (>25% accuracy)?
In order to move toward a solution to this problem I must identify my tools. I used python’s NLTK and SKLearn, for the text wrangling, tokenization, and vectorization. I used SKLearn’s K-means, Principal Component Analysis (PCA), and Multidimensional Scaling (MDS) algorithms for identifying underlying structure in the question text, and visualizing the results. I use Gensim’s Latent Dirichlet Allocation (LDA), to validate the k-means clusters results, and Word2Vec to create a model for similarity predictions.
From here we can delve into whether or not we can do well on an 8th graders test.
Scrubbing The Data
Unfortunately the dirty starts with getting the data into shape. The initial analysis was done completely on 2500 questions of the test set. The idea of this project is to find the connections between the text of the questions and the text of the correct answers. Luckily natural language processing is quick and easy with python’s NLTK package. In the data we are given the question’s text, the text of each answer (A-D) and the letter of the correct answer choice. A quick first step is to make a list for each column. The lists will be each column-row value as a str. Most of the words in a given column are not helpful to our goal. Words like ‘the’, ‘and’, ‘a’, etc, are considered stop-words. We use NLTK’s stop-words module to get the english stop-words. We then also make a list of all punctuations in english. This way ‘there.’ and ‘there’ will not be considered different. After removing stop-words, We need to remove words that have a function that isn’t relevant to our goal. In this instance, we want to identify nouns and verbs, and then keep those. I used NLTK’s pos_tag module to find these words, and filter out the rest. From here I use NLTK’s Snowball Stemmer to get the stems of each words. For example this would break ‘owe’ down to ‘ow’, and ’provision’ down to ‘provid’. This means that words with the same roots will be treated as the same word. This increases the density of words in the data. We use the word_tokenize module to tokenize the words in our data, creating a list of lists. Each list containing a list of words.
Here I have the top ten words in the data:
[('cells', 306),
 ('organisms', 264),
 ('plants', 254),
 ('scientists', 250),
 ('water', 247),
 ('energy', 184),
 ('species', 160),
 ('earths', 158),
 ('cell', 147),
 ('earth', 138),]
This looks good. If there are too many frivolous words (‘describe’, ‘count’, ‘number’, etc) I added those to my stop-words and processed again.
Phew! That’s a lot of text processing! Luckily, we can now move on clustering!
Do The Texts Of Tests Have Structure?
Clustering can be one of the more fun parts of an analysis, or a sad realization. If there is a clear clustering of the data, we learn a lot about the structure of our data. In this case we learn about the feasibility of a prediction algorithm. I want to find out whether there are different types of questions. Are these biology questions? Are they physics questions? Are there a combination of many topics? Even if there are, is the text too similar to identify using the text alone. The assumption is that if there are clearly different question groups there is a greater chance in identifying the correct answer through text similarity.
I used SKLearn’s TfidfVectorizer module to get a tfidf-matrix. I use the cosine_similarity module on the tfidf-matrix to create a distance matrix. The cosine_similarity is used to allow for an difference in the number of a words in common won’t affect the distance. With this distance matrix we can use SKLearn’s K-Means Clusters algorithm. I created models with a k from 5-20. I manually inspected these clusters to identify strongly connected topic groups. I found that a k of 10 had outstanding clusters. Greater than this there was much more redundancy between clusters and below this left out unique clusters.
I then printed out the clusters:
Top terms per cluster:
Cluster 0 words:
 scientists  earth  water  causes  human waves  affects temperature


Cluster 1 words:
 organization  living  classified  decomposers level  ecosystem


Cluster 2 words:
convert  chemical  reactions  store  transformed  release


Cluster 3 words:
 rocks  layer  sediment  sedimentary  rocks  weathering


Cluster 4 words:
 plant  plant  flowers  growing  plant  animals  fertility  reproduction


Cluster 5 words:
 energy  resource  convert  transformed  store  source  electric


Cluster 6 words:
 star  sun  planets  galaxy  way  milky


Cluster 7 words:
 cells functions  body  membrane  produced  cells  human


Cluster 8 words:
 species  population  extinction  survived  change  contributes


Cluster 9 words:
 atom  elements  elements  table  period  number  period  nucleus
I believe that readout is evidence of clear unique clustering of question text. To visualize this result I tried out the Multidimensional scaling with 2 components.
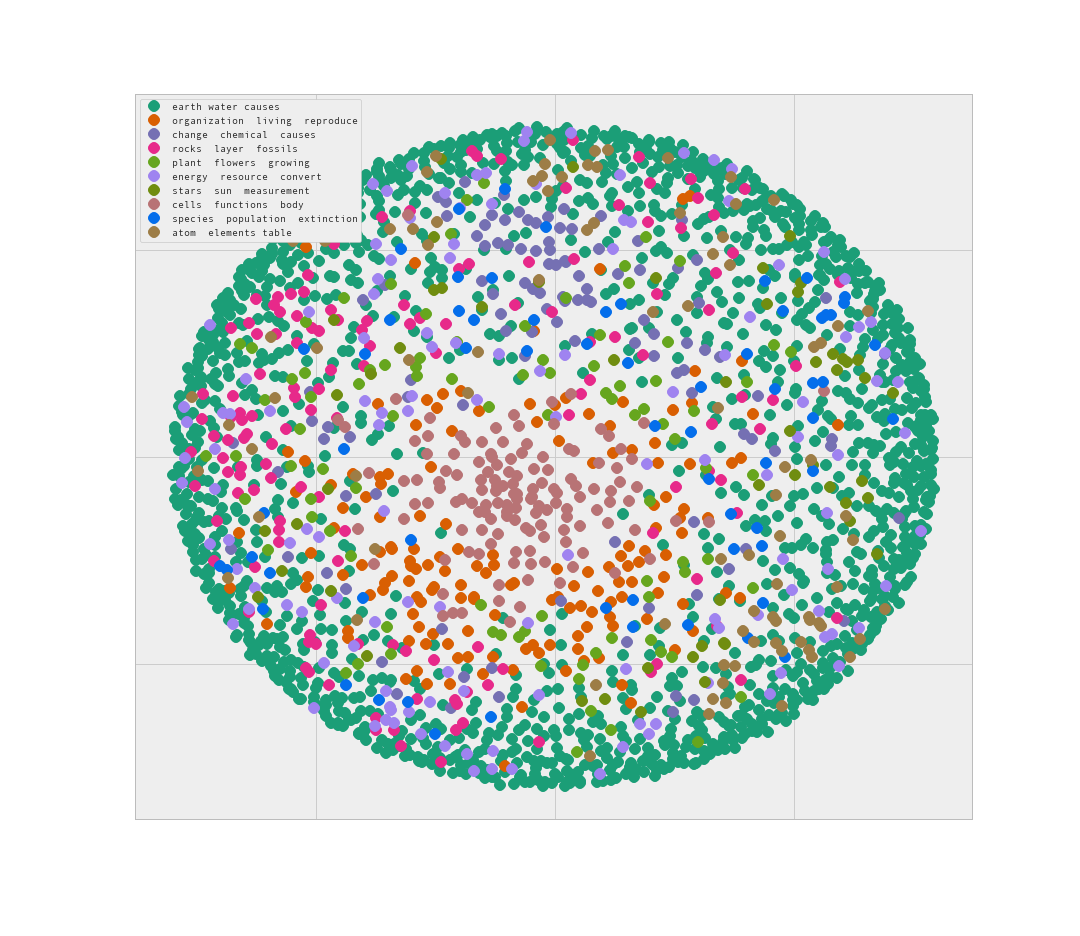
This is interesting. Looks like the data clusters form concentric circles around each other, with more strongly connected clusters at the middle. The lack of separation between clusters on the outside of the circle is troubling however.
Here I ran a PCA with 2 components to see if the algorithm produces a more clear result.
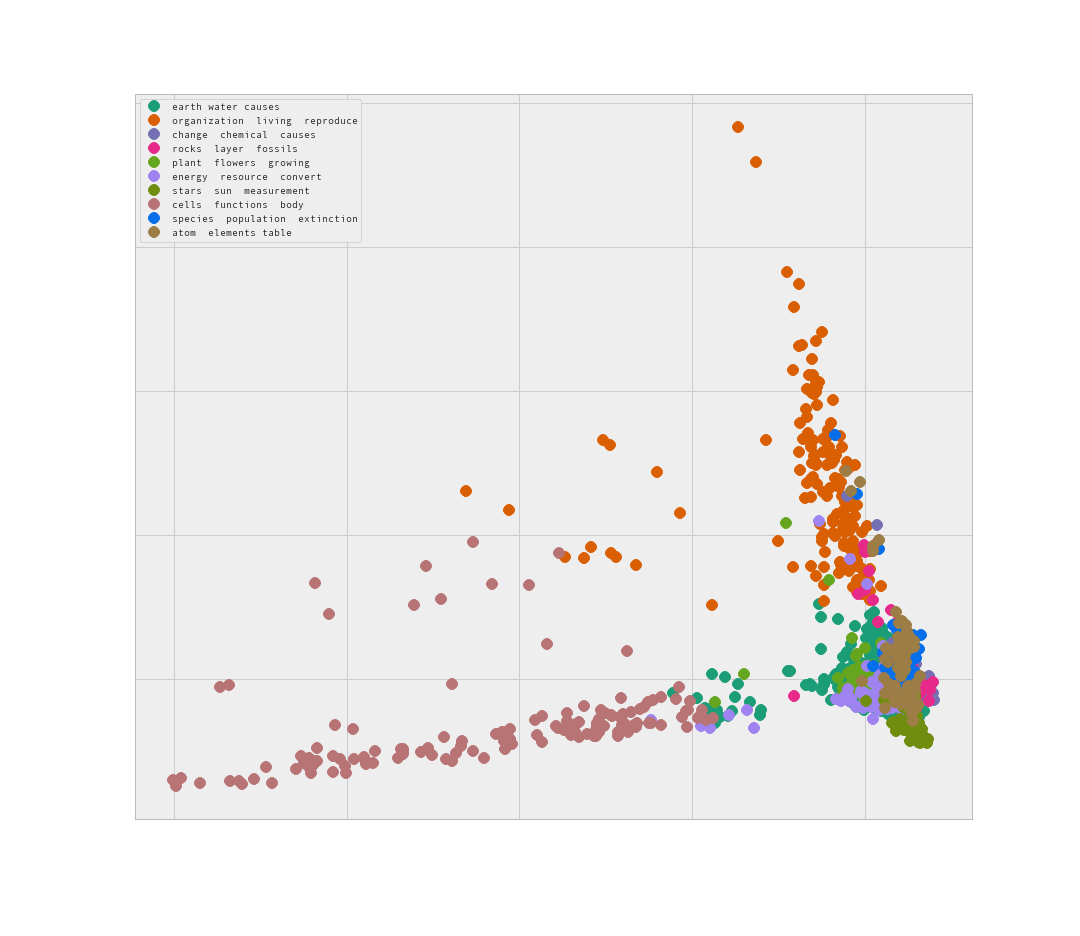
This looks promising. Some of the data is clearly separate, while there is a similar issue of ‘blobbing’ of clusters.
Let’s try 3-d and see if that helps us understand the clusters more.
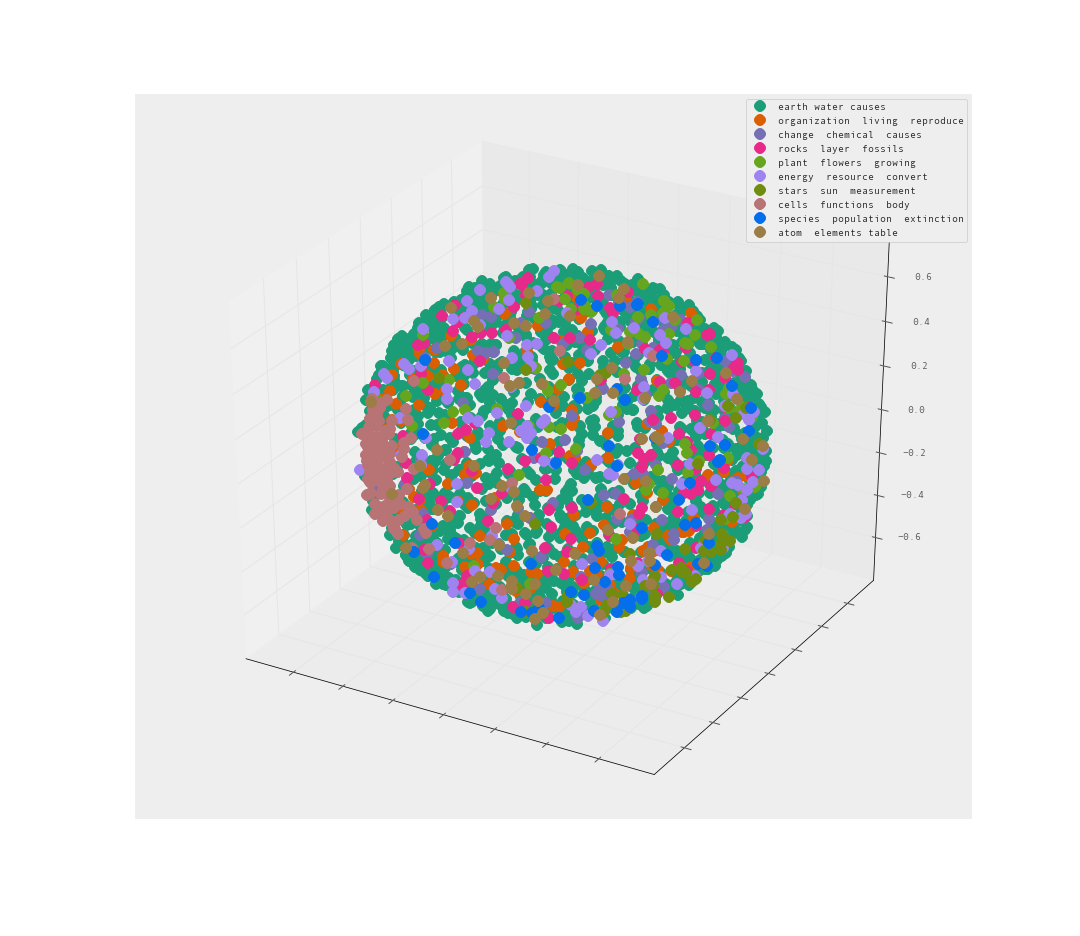
The MDS is less than helpful. A sphere of data is an unfortunate way to present the data. Many of the clusters may be hiding within the sphere.
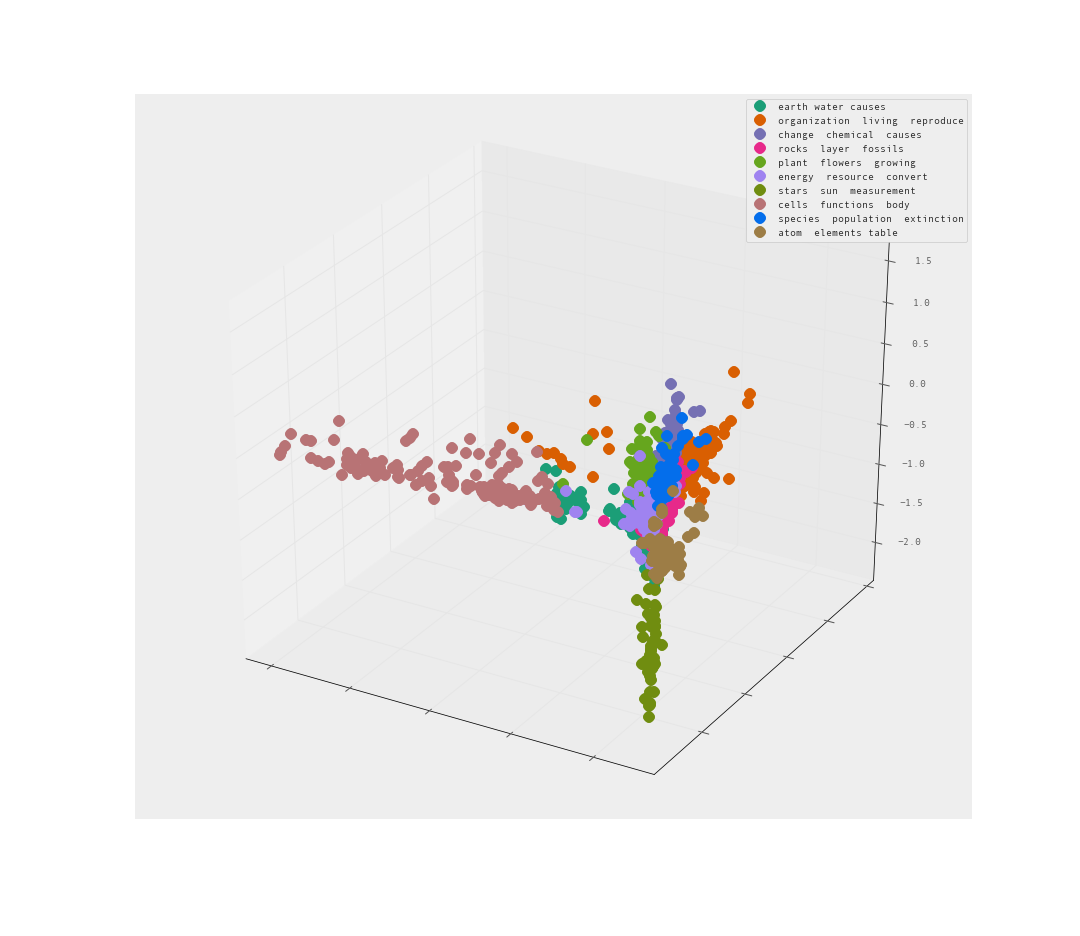
The PCA is pretty good I would say. Clear separation between clusters. Let’s look from the reverse angle as well.
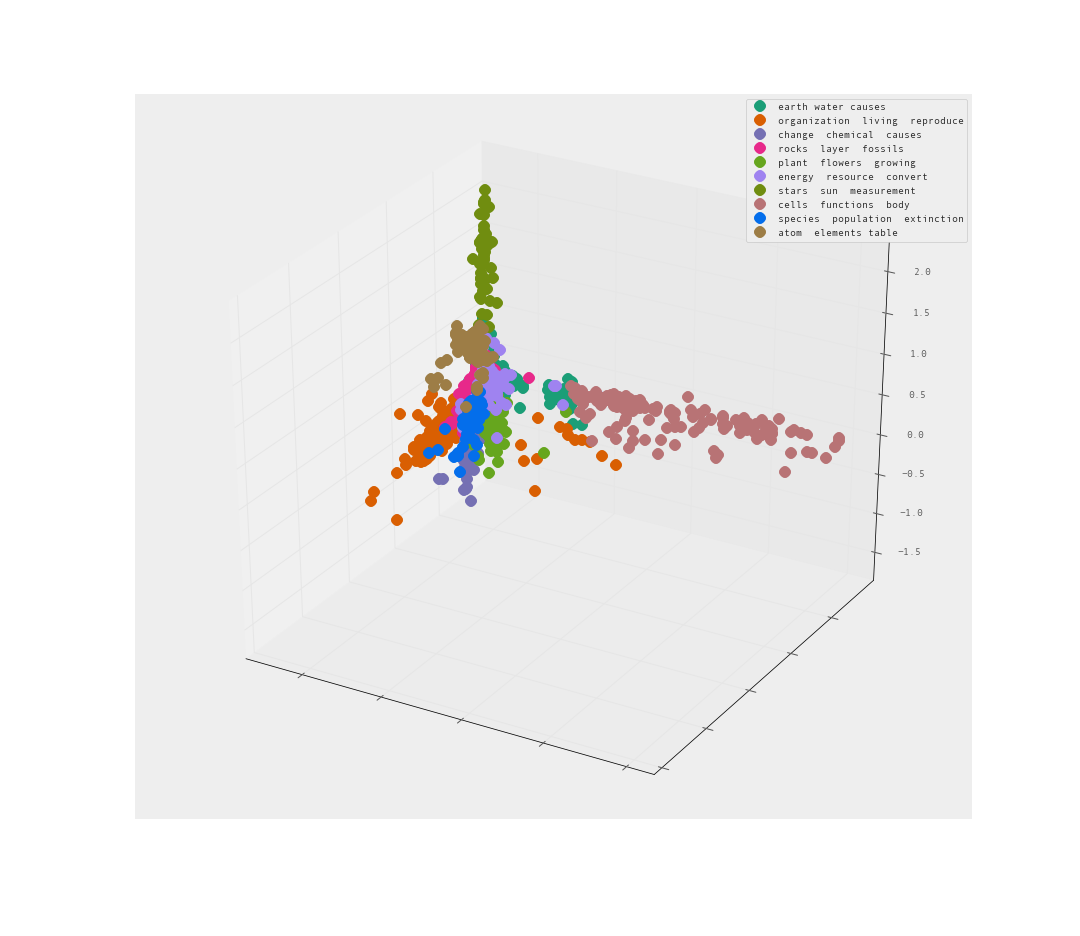
Yes! I am quite satisfied with the level of separation between these clusters. There are clearly clusters that share far too many words. There are also clusters that clearly branch away on their own.
I also performed an LDA for topic identification. Here is a snapshot of top topics:
[([(0.046474285186454863, u'organisms'),
   (0.02819212648772346, u'cells'),
   (0.022768510790354638, u'cell'),
   (0.014607910952826887, u'DNA'),
   (0.009496434065636954, u'molecules'),
   (0.0086459410996539404, u'living'),
   (0.0078257370609043208, u'organism'),
   (0.0074364615099413557, u'genetic'),
   (0.007063146813399139, u'traits'),
   (0.0069868117730546046, u'offspring')],
  -207.00041527429406),
 ([(0.031270595951505768, u'stars'),
   (0.029794494258043844, u'Sun'),
   (0.014378467713422034, u'planets'),
   (0.01357097404478195, u'Earth'),
   (0.010700437366352475, u'Way'),
   (0.010700437366352022, u'Milky'),
   (0.010143441596141939, u'species'),
   (0.0077697294599271367, u'force'),
   (0.0077335809455295439, u'star'),
   (0.0072504690695453511, u'distance')],
  -209.96048998789561),
 ([(0.014732458715605782, u'greatest'),
   (0.011013177679226178, u'cells'),
   (0.010936659384595848, u'fuels'),
   (0.010394284425006358, u'animals'),
   (0.009941057579404014, u'body'),
   (0.0095992681825492251, u'Which'),
   (0.0085500339145053745, u'energy'),
   (0.0081122589660600573, u'system'),
   (0.0064563307849186801, u'nutrients'),
   (0.0062600912855243097, u'systems')],
  -230.96773154525184),
 ([(0.015925980315557645, u'plates'),
   (0.015925974963741367, u'temperatures'),
   (0.013554076283027447, u'Earths'),
   (0.013462687320886228, u'scientists'),
   (0.0095310116357262571, u'species'),
   (0.0065563370696023991, u'investigation'),
   (0.0057300869976694311, u'sediments'),
   (0.0055564589956492265, u'rock'),
   (0.0055261656578793816, u'States'),
   (0.0054811328603365092, u'crust')],
  -239.14272899953946),
Looks like there are well formed and sensical topics. On investigation there is a lot of clear overlap between the results of the K-means and the LDA. Very promising results.
This looks to bode well for finding relationships between questions and their correct answers. Off to predictions.
Are We Smarter Than An 8th Grader?
Now we know that there is some underlying structure to our data, we can move forward in creating a predictive model. The are a few restrictions to the potential model that can be chosen. Unfortunate more obvious supervised learning algorithms are not helpful here. There is not a predefined set of classes. There are 4 answers that could have varying chances of likelihood, so each must be investigated.
This thinking lead me to using Word2Vec from gensim. This creates a vector of all words in the 2500 questions into as a word-vector. I can find the similarity of two lists of words using the n_similarity function of a gensim word-vector model. I can then find similarity scores by breaking the question into a list of words and looping through each potential answer as a list of words. By taking the answer with the maximum similarity I hope to identify the answer with largest relationship to the question.
When testing this on the test set I received an accuracy of 63.7%! This is a fairly incredible result. With 25% being the benchmark, it is clear that there is some value in investigating the relationship between how questions are asked and how answers are presented.
However, on the validation set on Kaggle, I received a very different result. This validation set had over 8000 questions and none in common with the test set. Instead of a cozy increase over guessing, I received 25.375%. This is an unfortunately small difference from random guessing.
Why could there be such a discrepancy? I believe it has to do a lot with the assumptions underlying my method. It is a very naive approach. I knew this from the start but I figured it was worth an investigation (it was!). First off, there are likely many words used in the answers that never appear in a question. I require the words found in the answer to be shared with words in at least similar questions. This makes questions with longer answers to have higher accuracy than short questions. Beyond this, what happens when every answer has high similarity to the question (same cluster). It is once again a toss up.
I would need to do some exploratory analysis of the validation set to see why there is such a huge difference in results. It is quite possible there are much less clear topics. The clusters don’t have much separation or there could be a significantly larger number of topics.
Take-Away
With these results, it is safe to say you should study. Maybe some tests have a fairly learnable structure, but the next test you could be out of luck.
In this case, I definitely recommend flash cards over Word2Vec.
2016: Andre Gatorano